Addressing and Partitioning
Table calculations are performed on a single measure in the view. The dimensions that define the part of the table you are applying the calculation to (computing along) are called addressing fields, and the dimensions that define how to group the calculation are called partitioning fields. In the example of a running sum of product sales across several years, the addressing field is the Date field, and the partitioning field is the product field. When you define the addressing for a table calculation, all the other dimensions are used for partitioning.
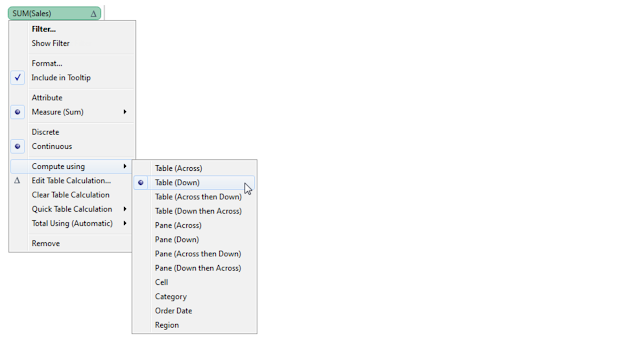
You specify addressing when you create or edit a table calculation, in the Table Calculation dialog box. To update addressing for a field in the view that already has a table calculation, right-click the field and choosing one of the options under Compute using. For example:
Addressing can be relative to the table structure (options beginning with Table, Pane, or Cell) or to a specific field (such as Category, Order Date, or Region). Addressing options based on table structure are described below.
Table (Across)
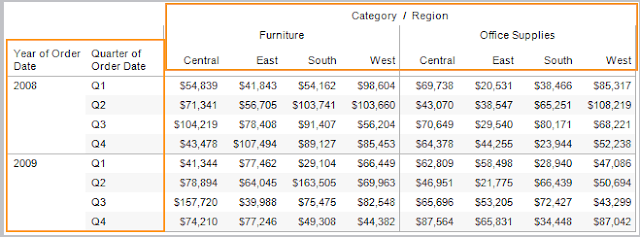
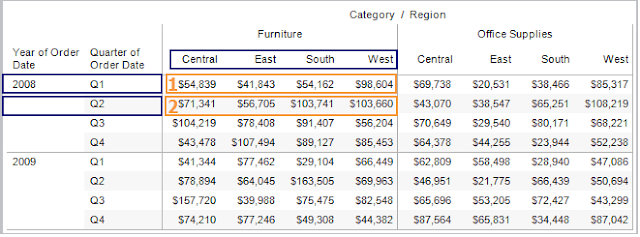
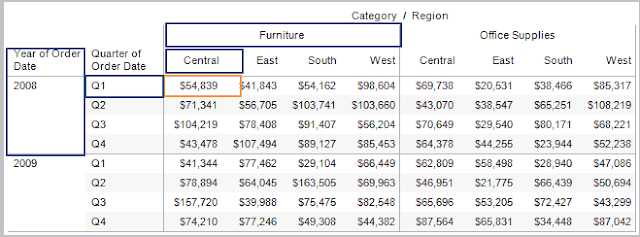
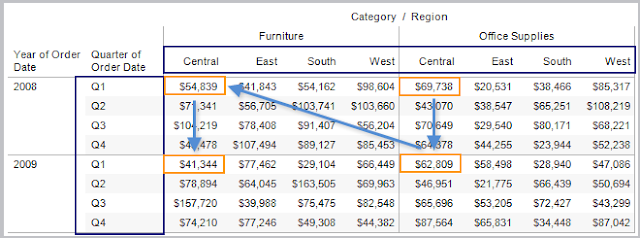
This option sets the addressing to compute along the entire table moving horizontally through each partition. For example, the view below shows quarterly sales by region and product category. When a calculation addressing is set to Table (Across), the dimensions that span horizontally across the table are the addressing fields (in the view below, Category and Region). All the other dimensions (Year, Quarter) are partitioning. The addressing dimensions are shown in orange, while partitioning dimensions are shown in blue.
That means that each partition will be the combination of Year and Quarter. Any calculation that is performed is scoped to the partition. For example, if the calculation is percent of total, the calculation will be performed on the numbers within each of the orange boxes.
Table (Down)
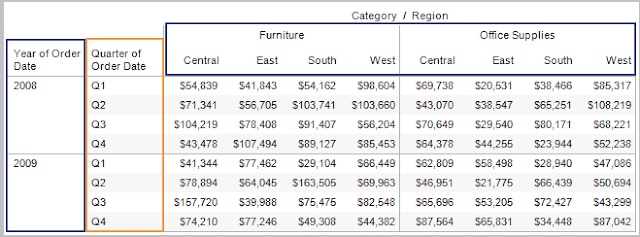
This option sets the addressing to compute along the entire table moving vertically through each partition. For example, the view from above is shown below with the addressing set to compute along Table (Down). The fields that span vertically (Year, Quarter) are now the addressing fields and the rest of the fields are partitioning (Category, Region). The addressing fields are shown in orange while partitioning fields are shown in blue.
That means that each partition is the combination of Category and Region.
Table (Across then Down)
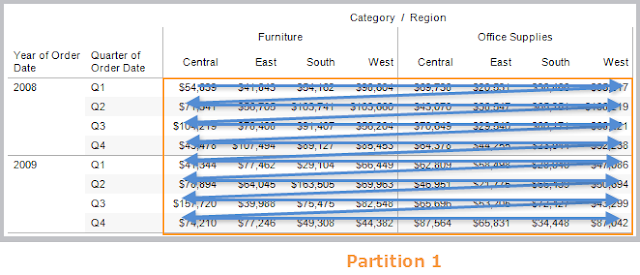
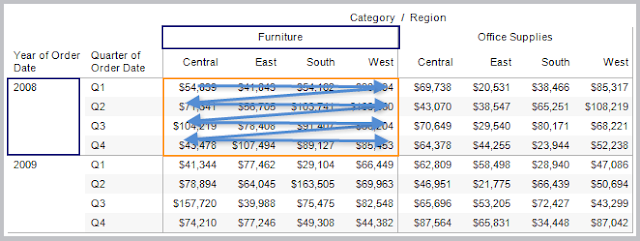
This option sets the addressing to compute across the entire table horizontally and then down the table vertically. This means that both the fields that span across the table and down the table are addressing fields.
That means that the entire table is the partition. The computation will compute across, move to the next row and continue to compute across, and so on.
Pane (Across)
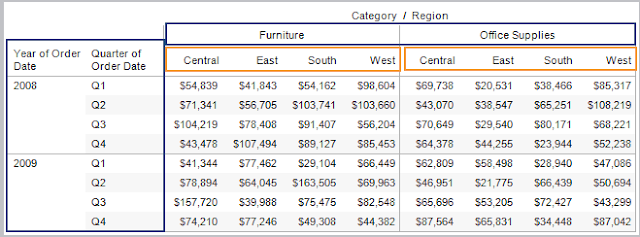
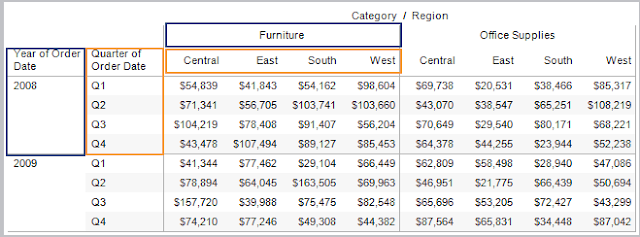
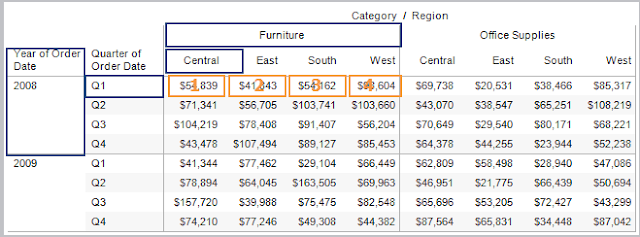
This option sets to compute across the pane horizontally. The fields that span across the pane horizontally are the addressing fields. However, the fields that separate the panes are now partitioning fields. In the example below Category becomes a partitioning field along with Year and Quarter. Region is the addressing field.
That means that the combination of Year, Quarter, and Category is the partition.
Pane (Down)
This option sets the addressing to compute down the table within the pane. The fields that separate the pane (Category, Year) are partitioning fields. In addition, Region becomes a partitioning field and Quarter is the addressing field.
That means that the combination of Year, Category, and Region is the partition.
Pane (Across then Down)
This option sets the addressing to compute across within the pane, then move to the next row and continue to compute across. The addressing fields are both the fields that run across the table horizontally and down the table vertically (Region, Quarter). The partitioning fields are the fields that define the pane (Category, Year).
That means that the combination of Category and Year make up the partition.
Cell
This option sets the addressing to the individual cells in the table. All fields become partitioning fields. This option is generally most useful when computing a percent of total calculation.
That means that the partition is the combination of Category, Region, Year, and Quarter.
Individual Fields
The individual dimensions in the view are listed below the option above in the Table Calculation dialog box. Use them to set the addressing to compute using the field you specify. The benefit of this option is that you get absolute control over how the calculation will be computed—if you change the orientation of your view, the table calculation will continue using the same fields for addressing and partitioning. Be careful though, because, addressing on an individual field means that when you rearrange the table, the calculation may no longer match the table structure.
Advanced
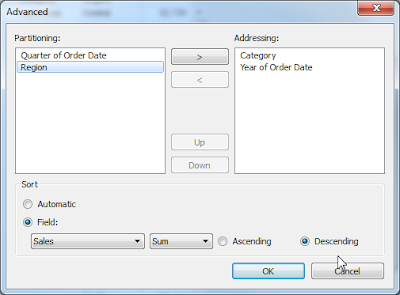
The advanced option lets you specify multiple fields to act as the addressing fields. When you select Advanced, a dialog box opens where you can specify one or more fields to act as addressing fields. Then you can specify how to order those fields.
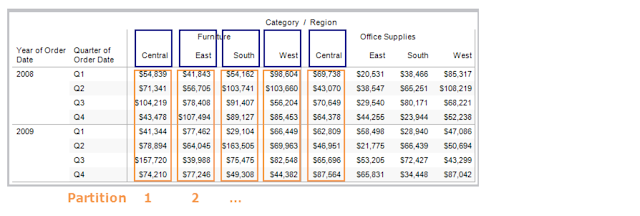
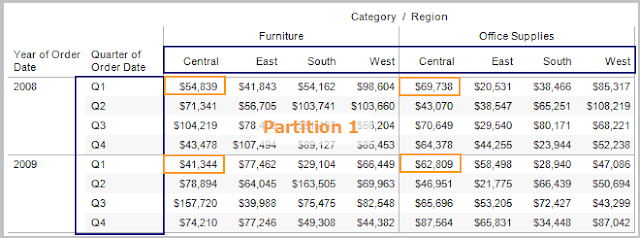
For example, in the view below the addressing fields are set to Category and Year. These are ordered by SUM(Sales), in descending order (from greatest to least). That means that the combination of Quarter and Region create the partition. Q1 Central exists four times in the table, and that is the partition.
Because the order is set to SUM(Sales), the calculation is computed based on their SUM(Sales) values from highest to lowest.

