One way to view a measure in Tableau Desktop is to split it into bins. You can think of bins as buckets based on a range of values. For example, say you have a measure that represents age. Instead of aggregating the measure to calculate the average age, you can bin the measure to define age groups: 0–5, 6–10, 11–15, and so on. Then you can count the number of people in each age group.
By default, Tableau creates even-sized bins based on a size you specify. In the example above, each bin represents five years. However, say you want to create bins of variable size, for example: under 21, 21–32, over 65, and so on. To do this, you can create a calculated field.
Create a calculated field for variable bin size
Step 1
Select Analysis > Create Calculated Field.
Step 2
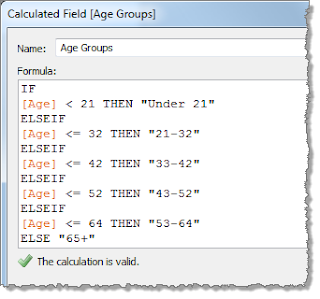
In the Calculated Field dialog box, complete the following steps.
- For Name, type Age Groups.
- In the Formula box, build the following formula, which defines several age groups:IF
[Age] < 21 THEN "Under 21"
ELSEIF
[Age] <= 32 THEN "21-32"
ELSEIF
[Age] <= 42 THEN "33-42"
ELSEIF
[Age] <= 52 THEN "43-52"
ELSEIF
[Age] <= 64 THEN "53-64"
ELSE "65+"
END
- Confirm that the status message indicates that the formula is valid, and then click OK.
Create a view with the variable bin field
Step 1
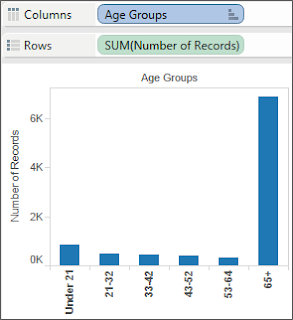
From the Measures pane, drag Number of Records to the Rows shelf.
Step 2
From the Dimensions pane, drag the new Age Groups field to the Columns shelf.
All of the records are split into the six bins that you defined in the calculated field.
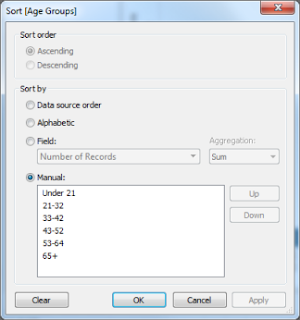
Note: To sort the bins, right-click Age Groups in the Columns shelf, and click Sort.


No comments:
Post a Comment